Introduction
In my previous article, we’ve seen what Virtual Threads (VTs) are, how they differ from Platform Threads (PTs), and how to use them with Helidon 4.
In simple terms, VTs bring in a new concurrency model. Instead of using many PTs that can get blocked, we use a few of them that hardly ever get blocked. Blocking a PT is expensive and can restrict how much we can scale up. On the other hand, VTs can be blocked without any extra cost.
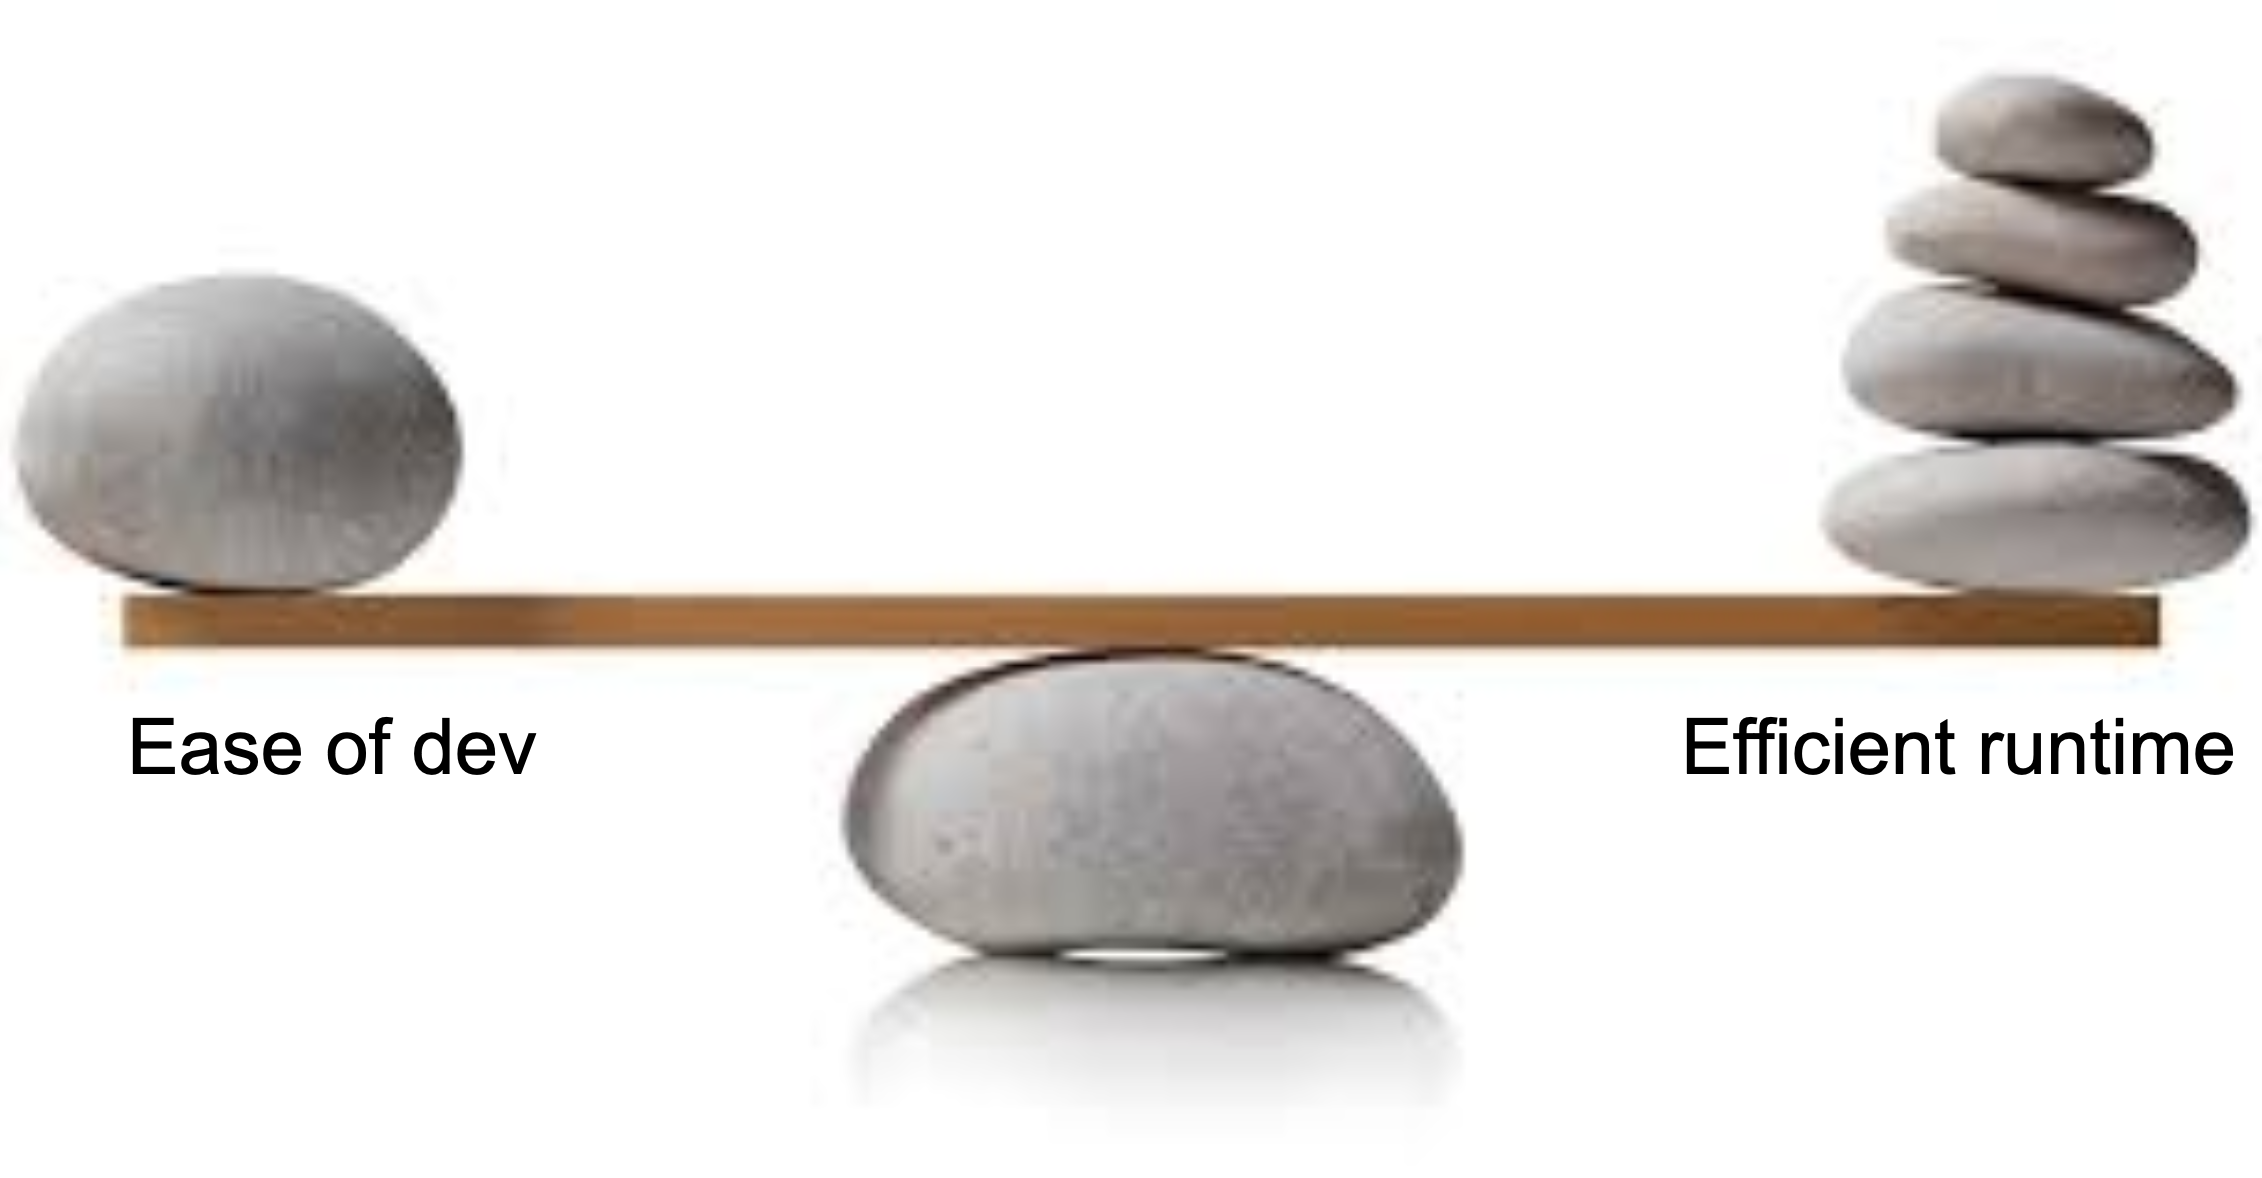
With VTs, we can keep coding in a straightforward way, without having to use more complicated reactive programming, and still get the benefits of efficient runtime. In other words, we no longer have to deal with the « ease of code vs runtime efficiency » dilemma.
To explore this subject further, I invite you to watch my talk A Dev perspective on Java Loom at EclipseCon 2023.
Specifics of Virtual Threads monitoring
One important thing to consider with this change is monitoring: How can we make sure that our applications are using VTs in the best way? What exactly do we need to monitor when it comes to VTs?
To answer that question, we need to understand how VTs work under the hood, especially how blocking operations are managed:
Inside the JVM, everything is centered around a class known as Continuation. It’s an internal Java class, so as developers, we don’t need to interact with it directly. Java internals like the NIO library and the Garbage Collectors have been revised to utilize it.
Continuation exposes 2 main methods:
- run to start (or restart) a task
- yield to suspend the running task.
Internally, a VT delegates its task execution to an instance of Continuation.
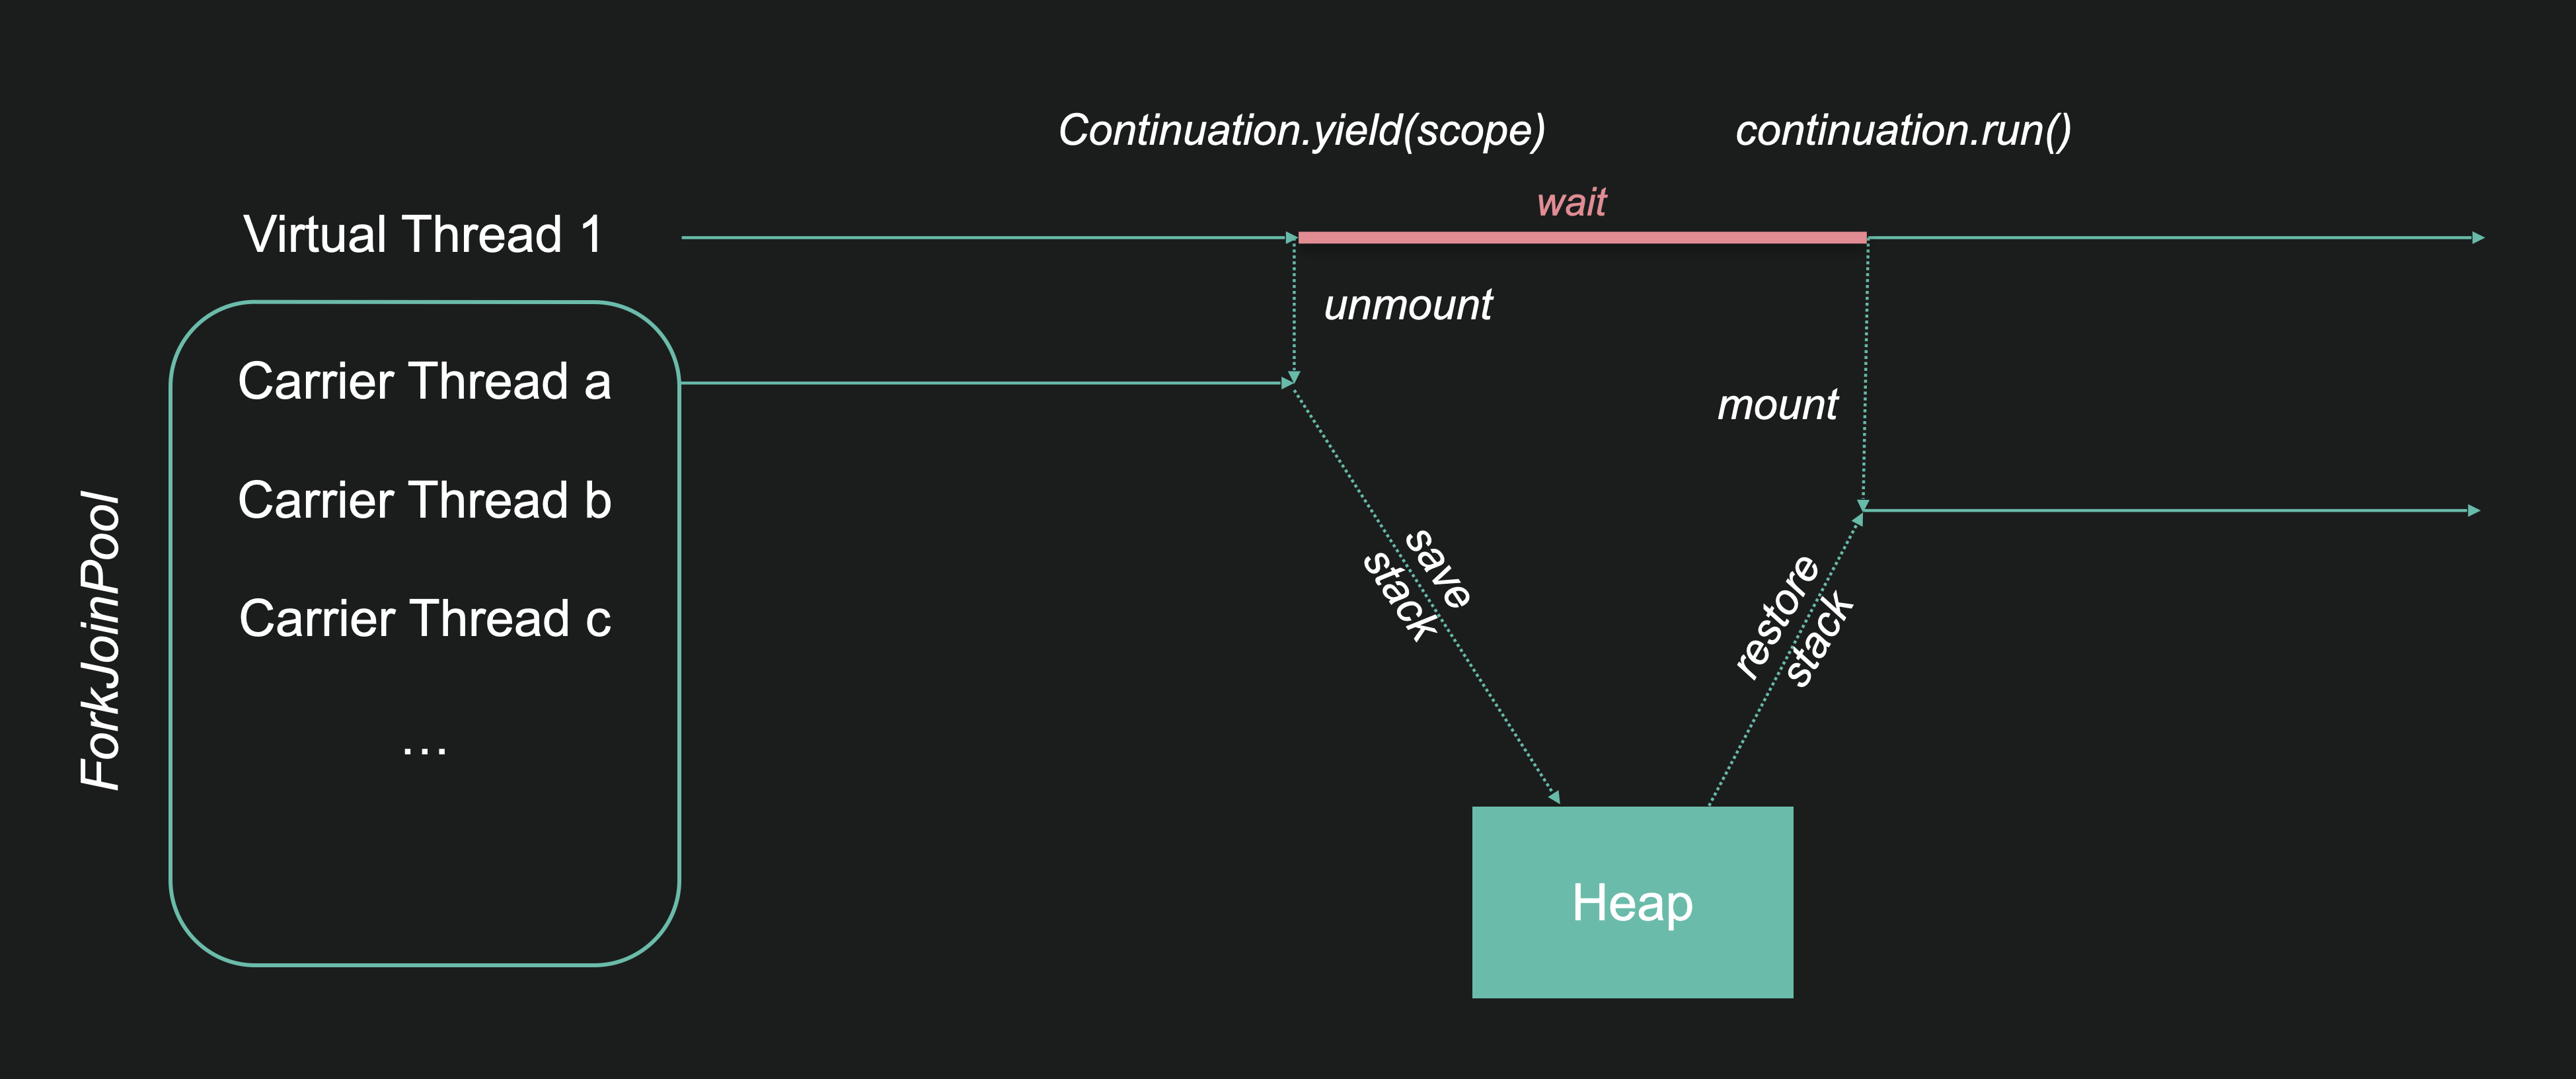
By nature, a VT is a lightweight construct with no execution capacity of its own. When it runs, it is mounted on a PT. More precisely, this PT comes from a ForkJoinPool of PTs dedicated to VTs execution. These specialized PTs are called Carrier Threads (CTs).
Virtual Thread (VT), Platform Thread (PT), Carrier Thread (CT), that’s a lot of vocabulary. Don’t worry, it’ll all become clear!
When a VT is blocked, for example when it’s waiting for an IO, Continuation.yield is called and the VT is unmounted. The CT doesn’t block (this is the magic!), it returns to the pool, ready to run any other VT.
When the I/O is completed, Continuation.run is called (by a JVM internal Read-Poller thread) and the VT is remounted on a CT (not necessarily the same as before) to restart the task.
To enable this mount/unmount mechanism, we need to save and restore the Java stack, the task’s execution context. It is saved on the Java heap, where all objects are stored. This means that VTs usage increases the memory footprint and adds pressure on the Garbage Collector (GC). As Java developers, we are aware that latency and scalability worsen when the GC starts making full collections. This is even more true with VTs!
Clearly, the use of VTs reinforces the need to monitor memory footprint and Garbage Collector activity.
We can do this by using classic means such as:
- Java launch options: -Xlog:gc or -XX:NativeMemoryTracking
- Java Flight Recorder (JFR) events.
Tracking pinned threads
So, thanks to the magic of Continuation, CTs never block… Really? Well, they almost never block. In some circumstances, a VT cannot be unmounted blocking its CT.
This happens when Java stack addresses are referenced from non-Java code. Java adresses are relocated when restoring from the heap, making non-Java references no longer good.
To prevent this error, the CT is pinned:
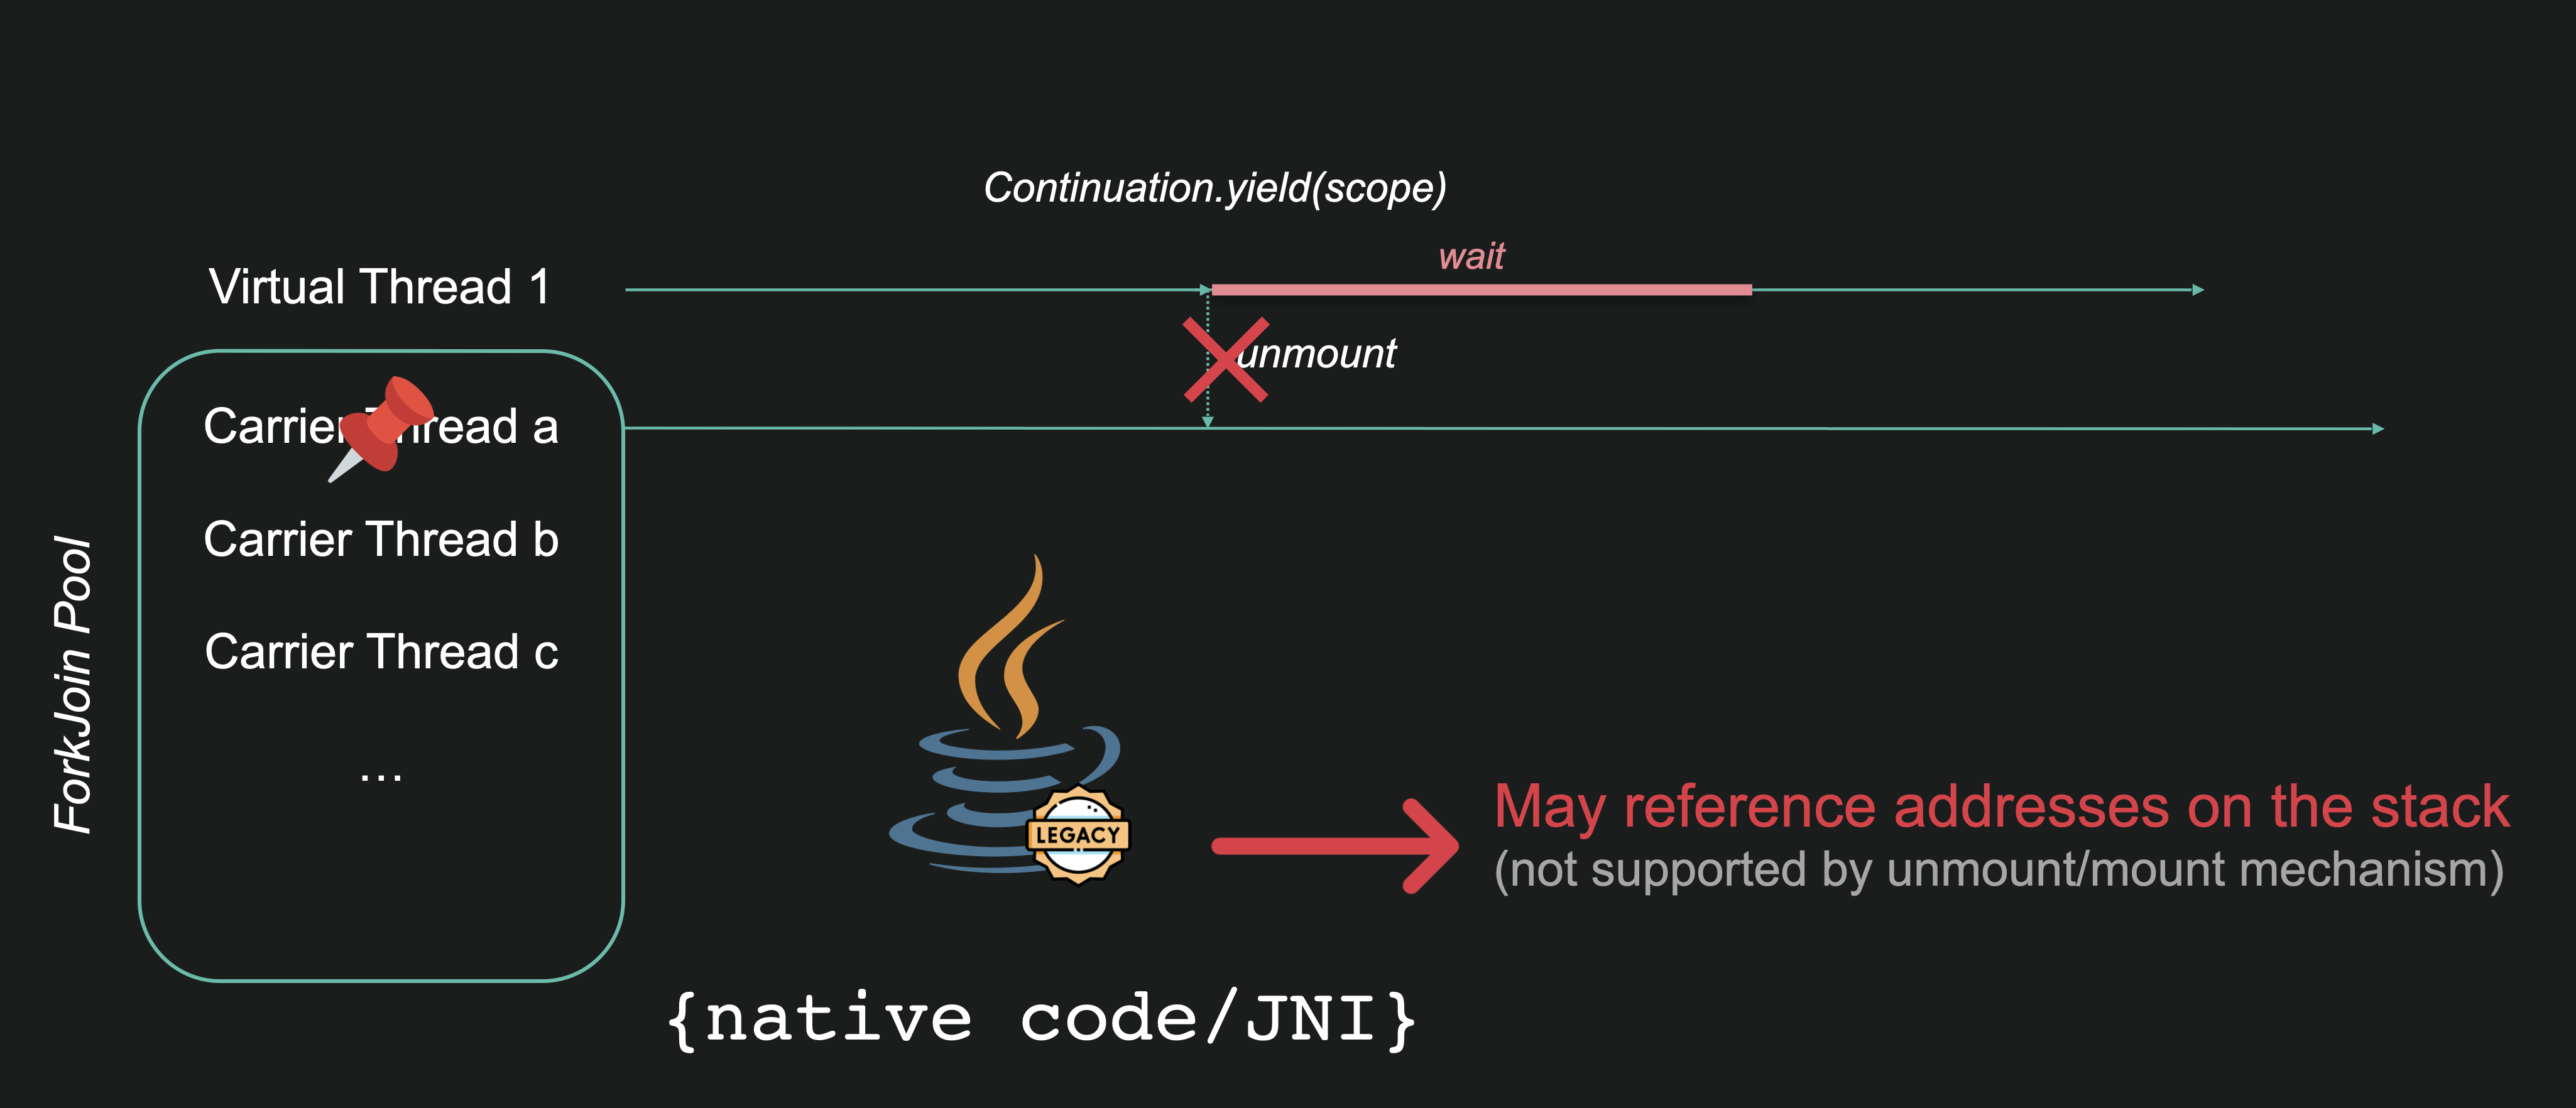
This happens when calling:
- synchronized blocks or methods
- native code: internal code from the JVM itself or external call code using JNI or Foreign Functions.
Is that a problem? It depends… This can limit performance when the processing behind the pinned thread is slow and frequently called. For example, in a JDBC driver. On the other hand, when processing is fast or invoked infrequently, it’s not a problem.
That means that we have to track pinned threads to identify those likely to affect performance
We can do this with:
- -Djdk.tracePinnedThreads Java launch option: it enables to determine where pinned threads occur in the code
- JFR event
jdk.VirtualThreadPinned: It enables to identify pinned threads that can affect performance. This event is enabled by default with a threshold of 20 msec (can be configured):
For instance, this configuration enables to track pinned threads with an execution threshold of 5 ms:
<event name="jdk.VirtualThreadPinned">
  <setting name="enabled">true</setting>
  <setting name="stackTrace">true</setting>
  <setting name="threshold">5 ms</setting>
</event>
In that case, only pinned threads lasting more than 5 msec are monitored.
How does my framework use VTs?
There is no single, standard way of using VTs. Each framework does so according to its architecture and technical requirements.
As we saw in my previous article, Helidon 4 proposes a radical approach where business code systematically executes in the context of VTs:
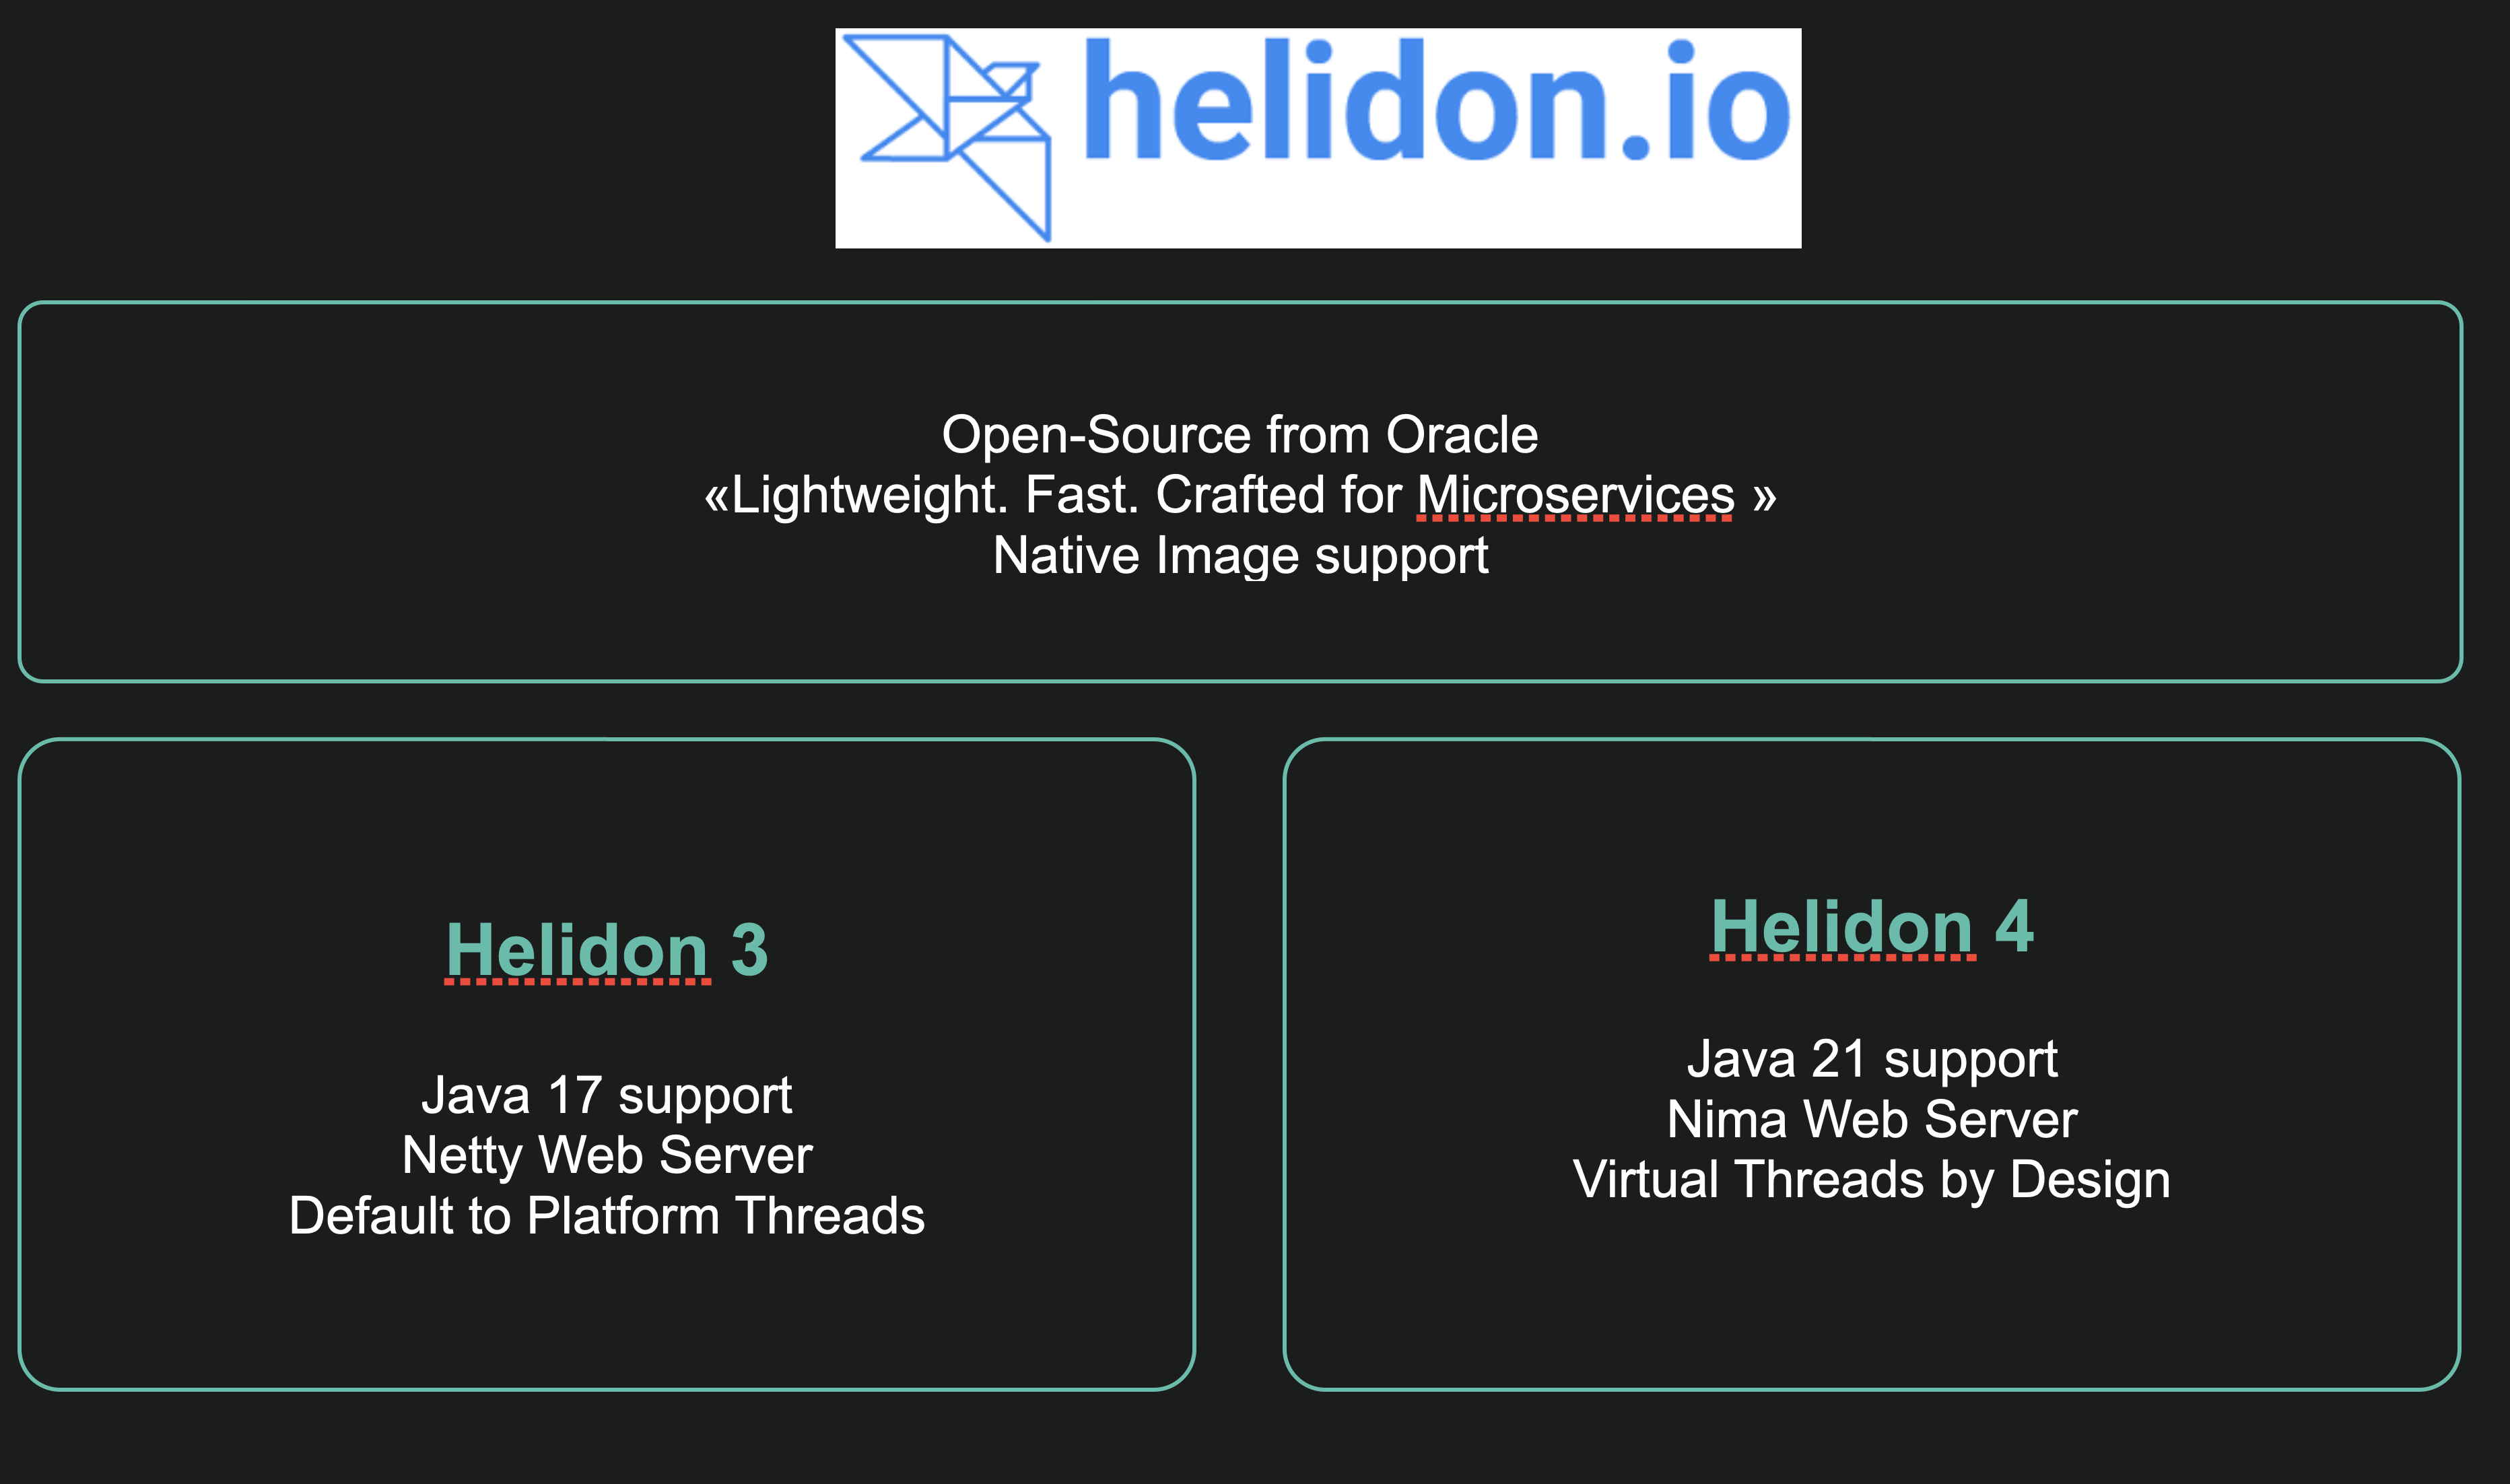
It should be noted that, internally, Helidon 4 makes use of PTs for its own connection management needs. It is the business code that systematically runs in VTs.
Because of its architecture, Quarkus offers a different approach. By design, Quarkus uses two types of specialized PTs:
- IO Threads, which execute IO and non-blocking reactive code
- Workers Threads, which execute blocking code.
As an option, it is possible, thanks to a specific annotation, to execute blocking code on VTs:
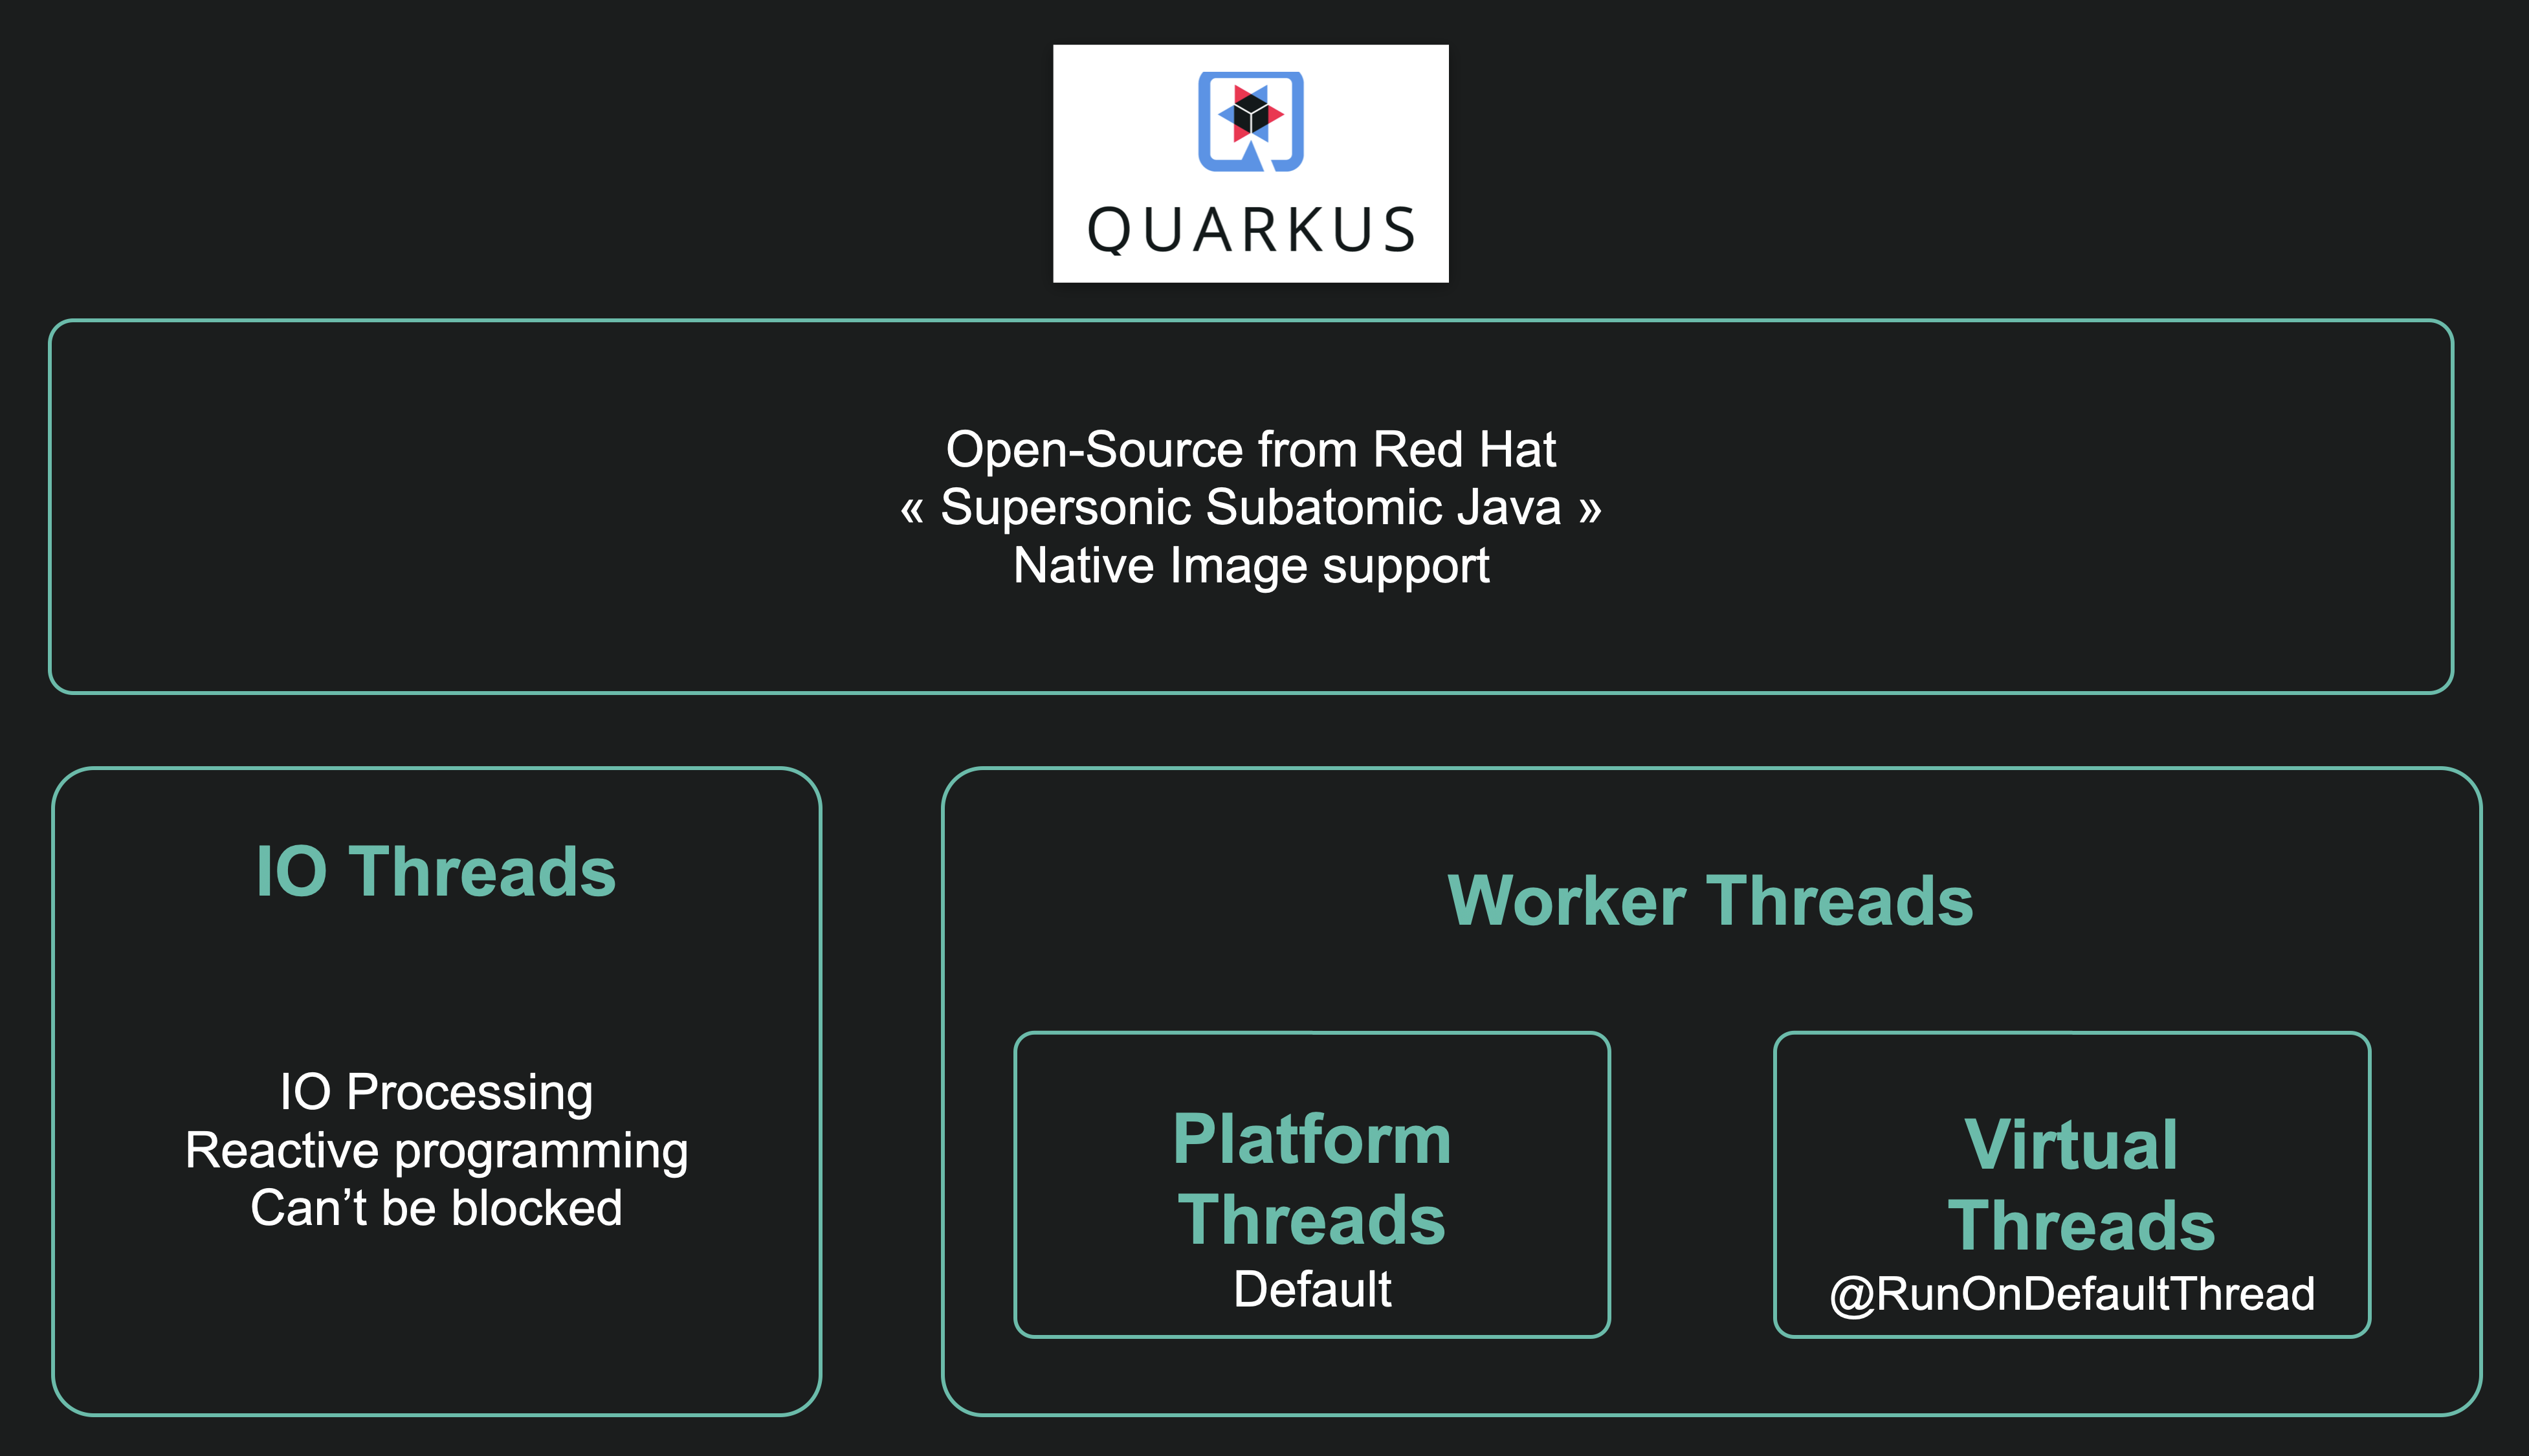
This is a hybrid approach that allows for gradual adoption of VTs.
So, Helidon’s radical approach or Quarkus’ hybrid approach, which is better? There is no absolute answer. It depends on the context:
- The radical approach has the merit of simplicity. On the other hand, it’s not optimal for CPU-bound processing or when pinned threads penalize performance
- The hybrid approach allows gradual, controlled adoption of VTs. On the other hand, it is not ideal insofar as it leads to context switches between IO Threads and VT workers. Quarkus architecture will probably evolve to better use VTs.
These two examples show that we need to understand how our favorite framework uses VTs and monitor how VTs are created and removed.
This can be done by enabling and tracking JFR events: jdk.VirtualThreadStart and jdk.VirtualThreadEnd. These events are disabled by default, to enable them, it is necessary to use a specific JFR configuration:
<event name="jdk.VirtualThreadStart">
  <setting name="enabled">true</setting>
  <setting name="stackTrace">true</setting>
 </event>
<event name="jdk.VirtualThreadEnd">
  <setting name="enabled">true</setting>
</event>
To use this config:
java -XX:StartFlightRecording,settings=/path/to/jfr-config ...
Monitoring the ForkJoinPool
As we have seen, the ForkJoinPool plays a key role in VTs scheduling. If the pool is too small, scheduling will slow down and decrease performance.
The ForkJoinPool can be configured using the following system properties:
- jdk.virtualThreadScheduler.parallelism: the pool size (how many CT), defaults to the number of CPU cores
- jdk.virtualThreadScheduler.maxPoolSize: the maximum size of the pool, default to 256. The number of CTs can exceed temporarily the number set by the parallelism value when CTs are blocked (due to OS or JVM limitations). Beware that the scheduler does not compensate for pinning by expanding its parallelism
- jdk.virtualThreadScheduler.minRunnable: the minimum number of threads that are kept runnable in the pool.
In most cases, the default values are appropriate and there’s no need to change them.
At this stage, I haven’t identified any way of monitoring the ForkJoinPool dedicated to VTs. It would be interesting, for example, to have metrics to determine VTs scheduling latencies (how long does it take to a VT to be mounted on a CT) and thus adapt the configuration accordingly.
Conclusion
In this article, we have identified the main technical elements to be monitored when using VTs:
- memory heap size and GC activity: these are classic monitoring elements that need to be reinforced with VTs
- pinned threads, particularly those likely to affect performance
- VTs creation: each framework has its own VTs usage strategy that needs to be understood
- ForkJoinPool scheduler sizing: inappropriate sizing can lead to a slowdown in performance, even if there’s no real way of monitoring (to my knowledge), we can do something about the configuration
Overall here are Java options I recommend:
java \
   -Djdk.tracePinnedThreads=short \
   -XX:NativeMemoryTracking=summary \
   -Xlog:gc:/path/to/gc-log \
   -XX:StartFlightRecording,settings=...,name=...,filename=...  \
   -jar /path/to/app-jar-file
We’ll look at a concrete approach with Helidon and Quarkus in my next article.
References
Networking I/O with Virtual Threads – Under the hood
The Ultimate Guide to Java Virtual Threads

Leave a comment